

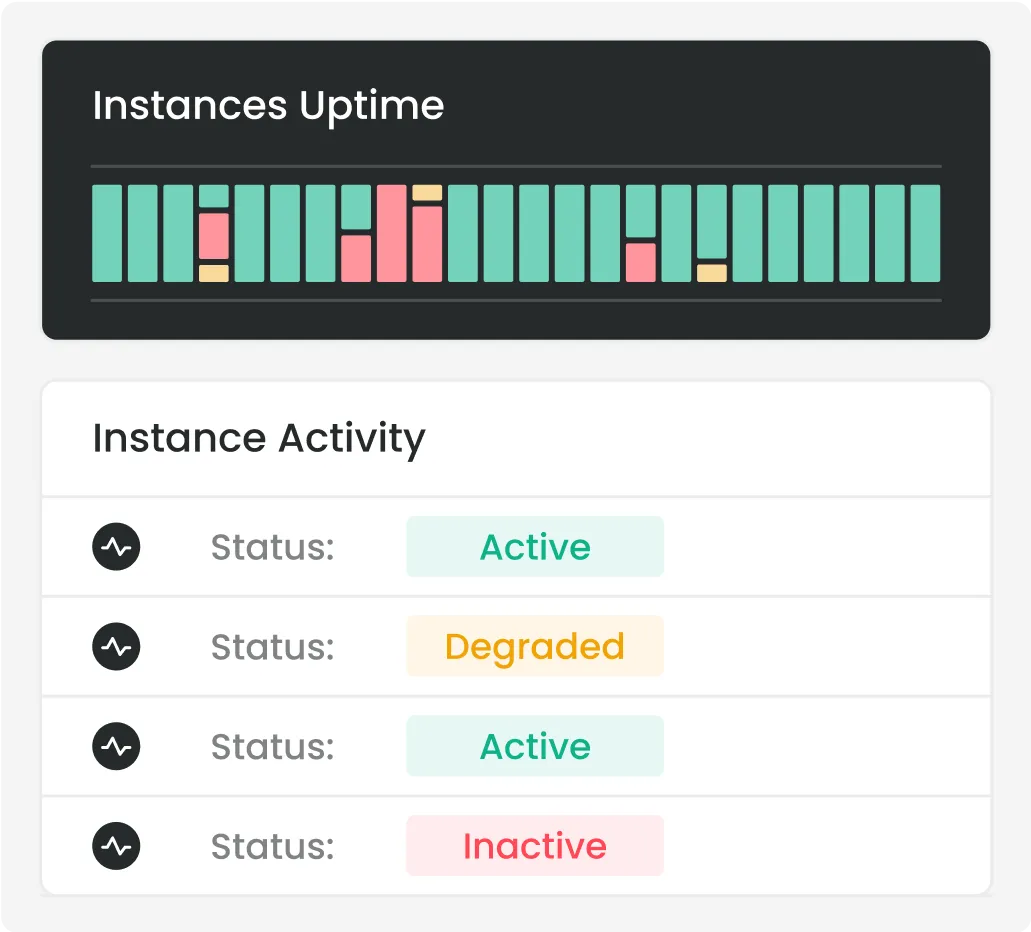


Testing Releases in Customer-representative Environments
Automatically test your new releases on truly customer-representative environments—same cloud provider, same Kubernetes distribution and version, and even the same entitlements and configuration.
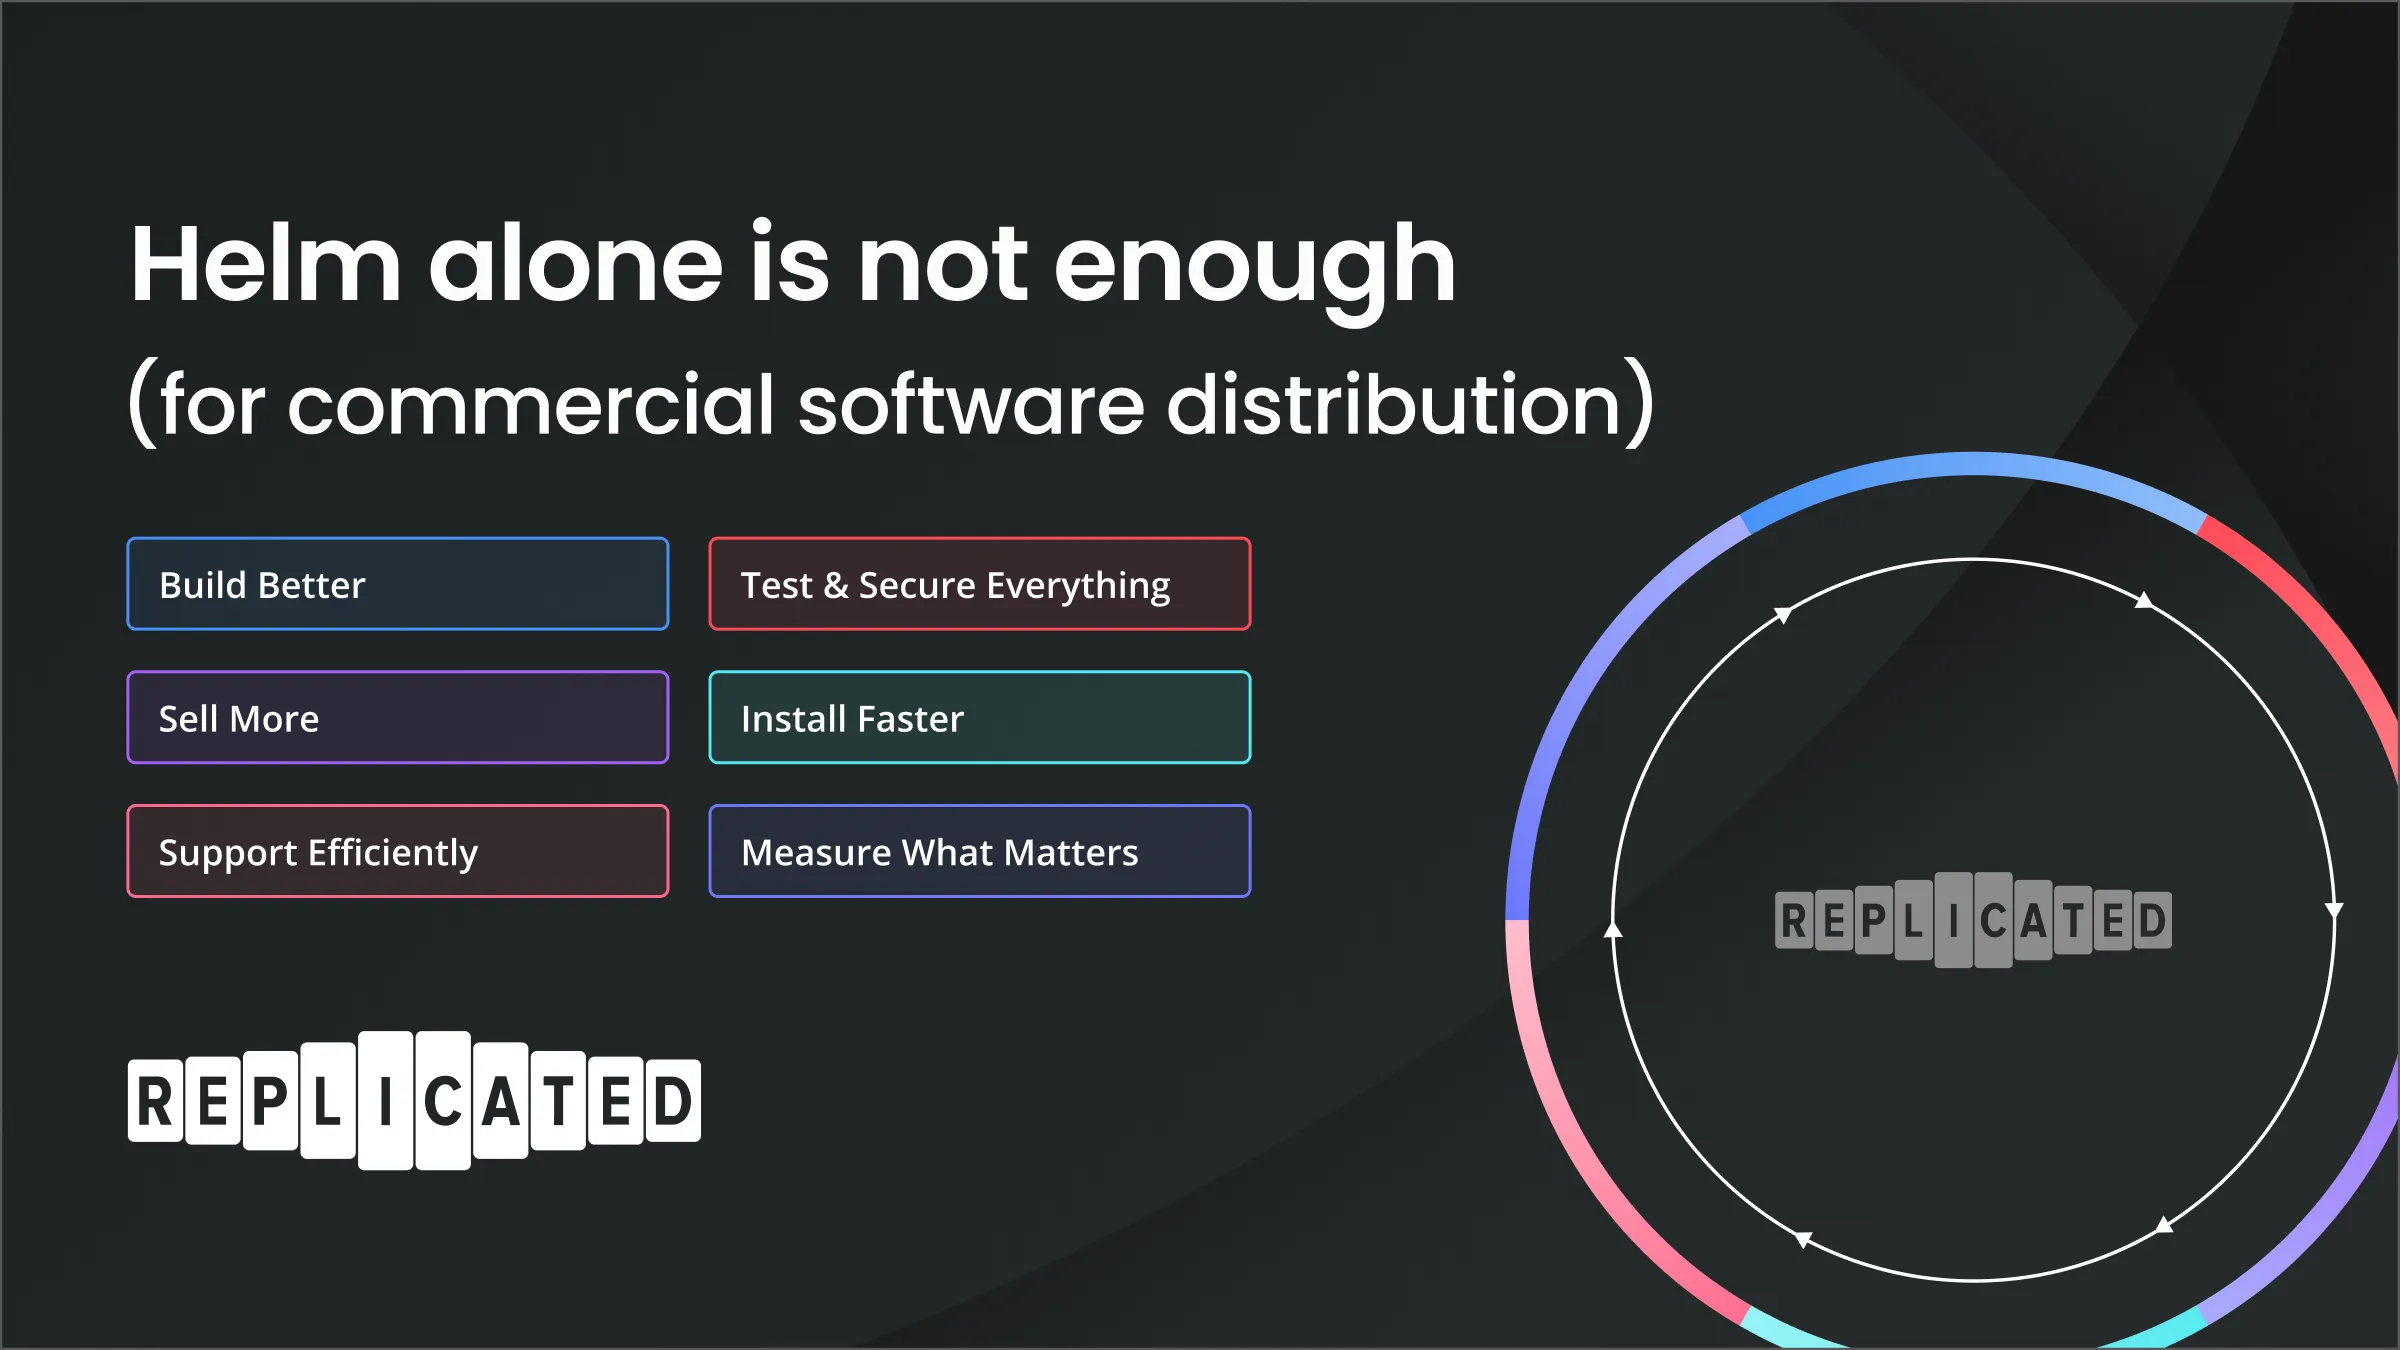
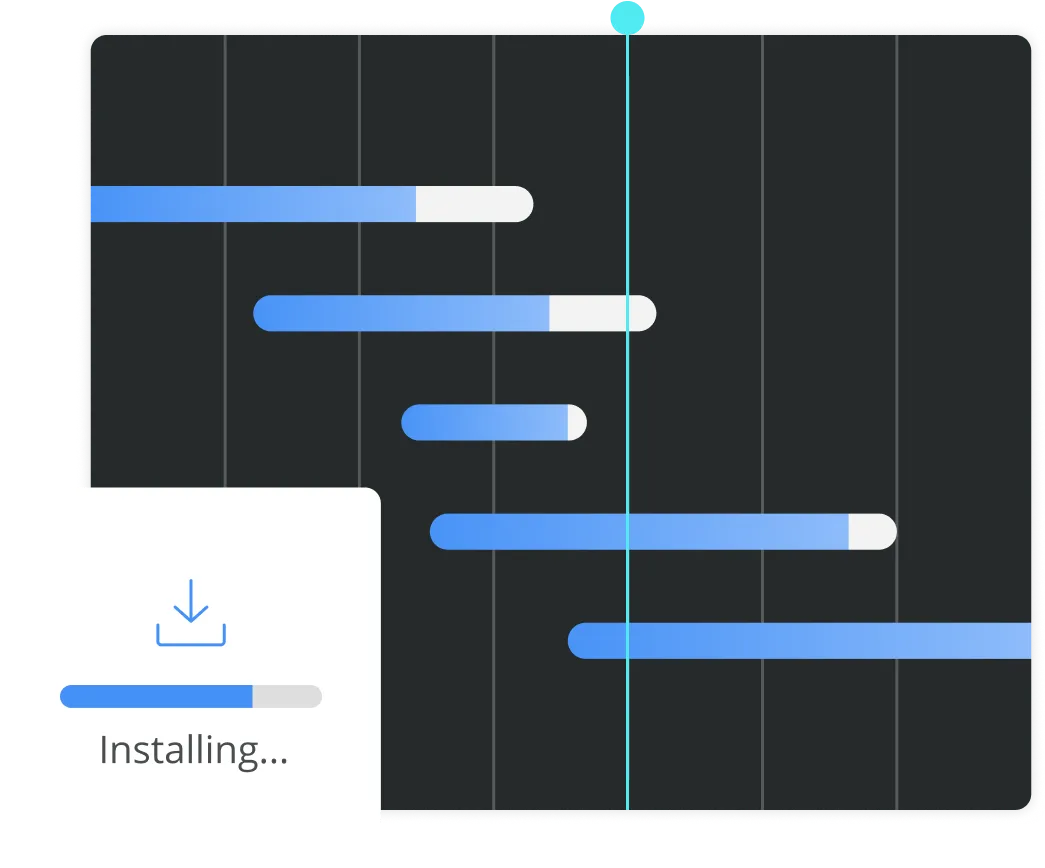
Helm alone is not enough (for commercial software distribution)
We love Helm! But, using just Helm for commercial software distribution can only take you so far. Luckily, Replicated's new features perfectly complement Helm to supercharge your deployments.
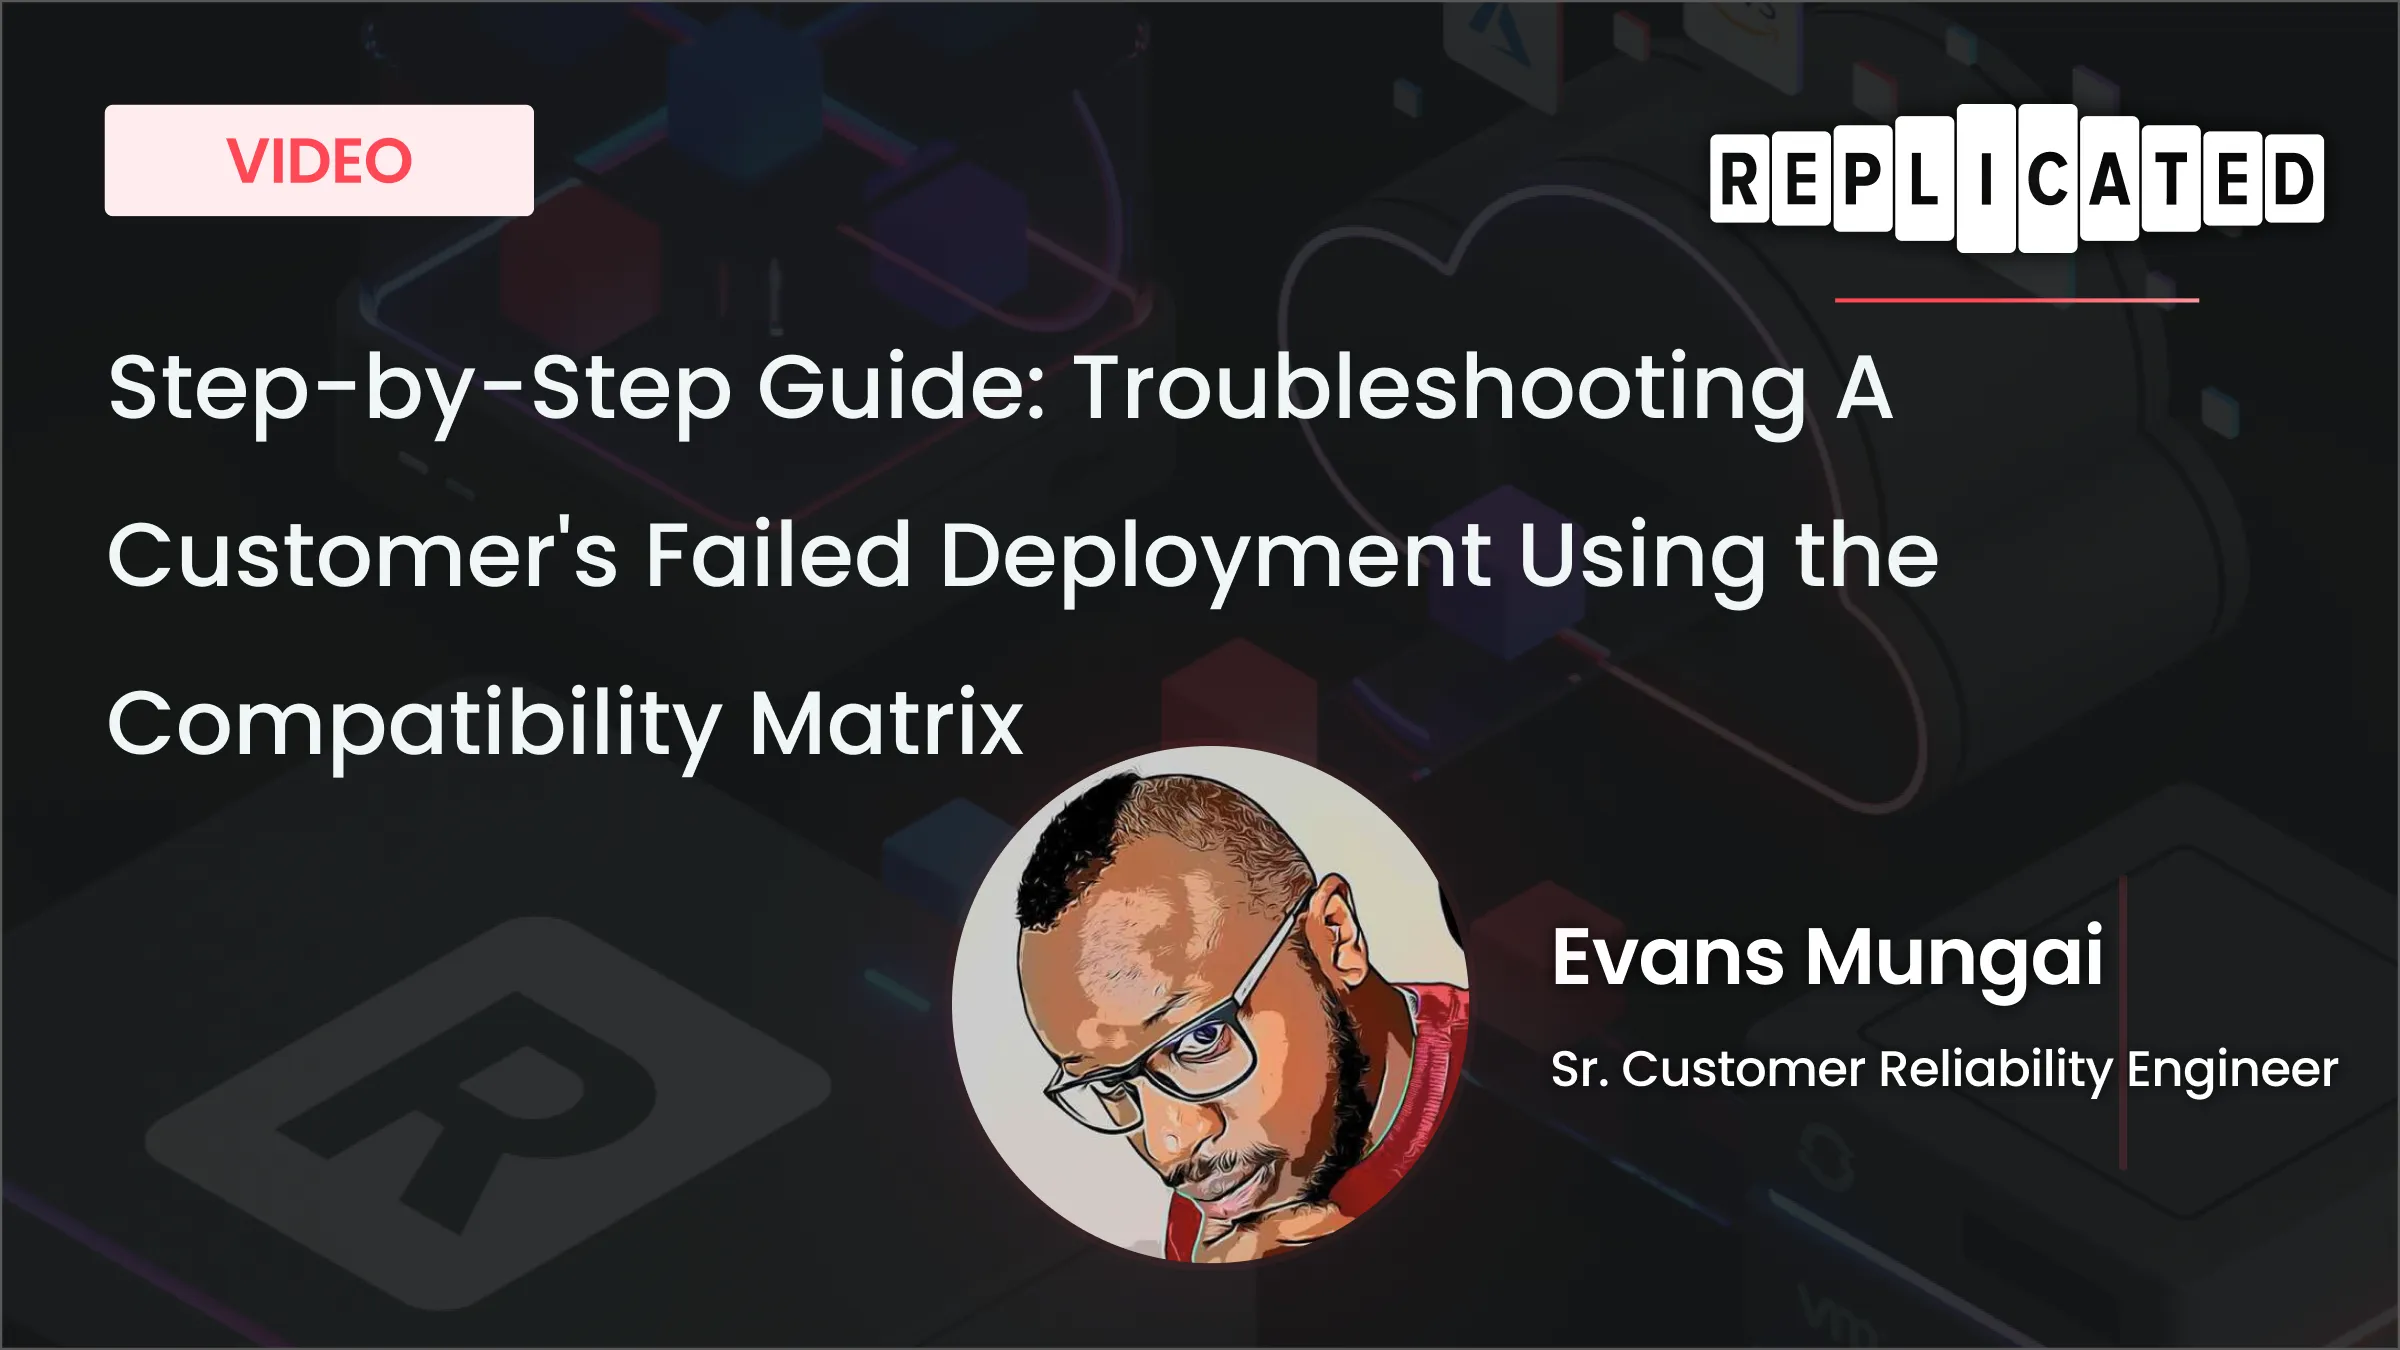
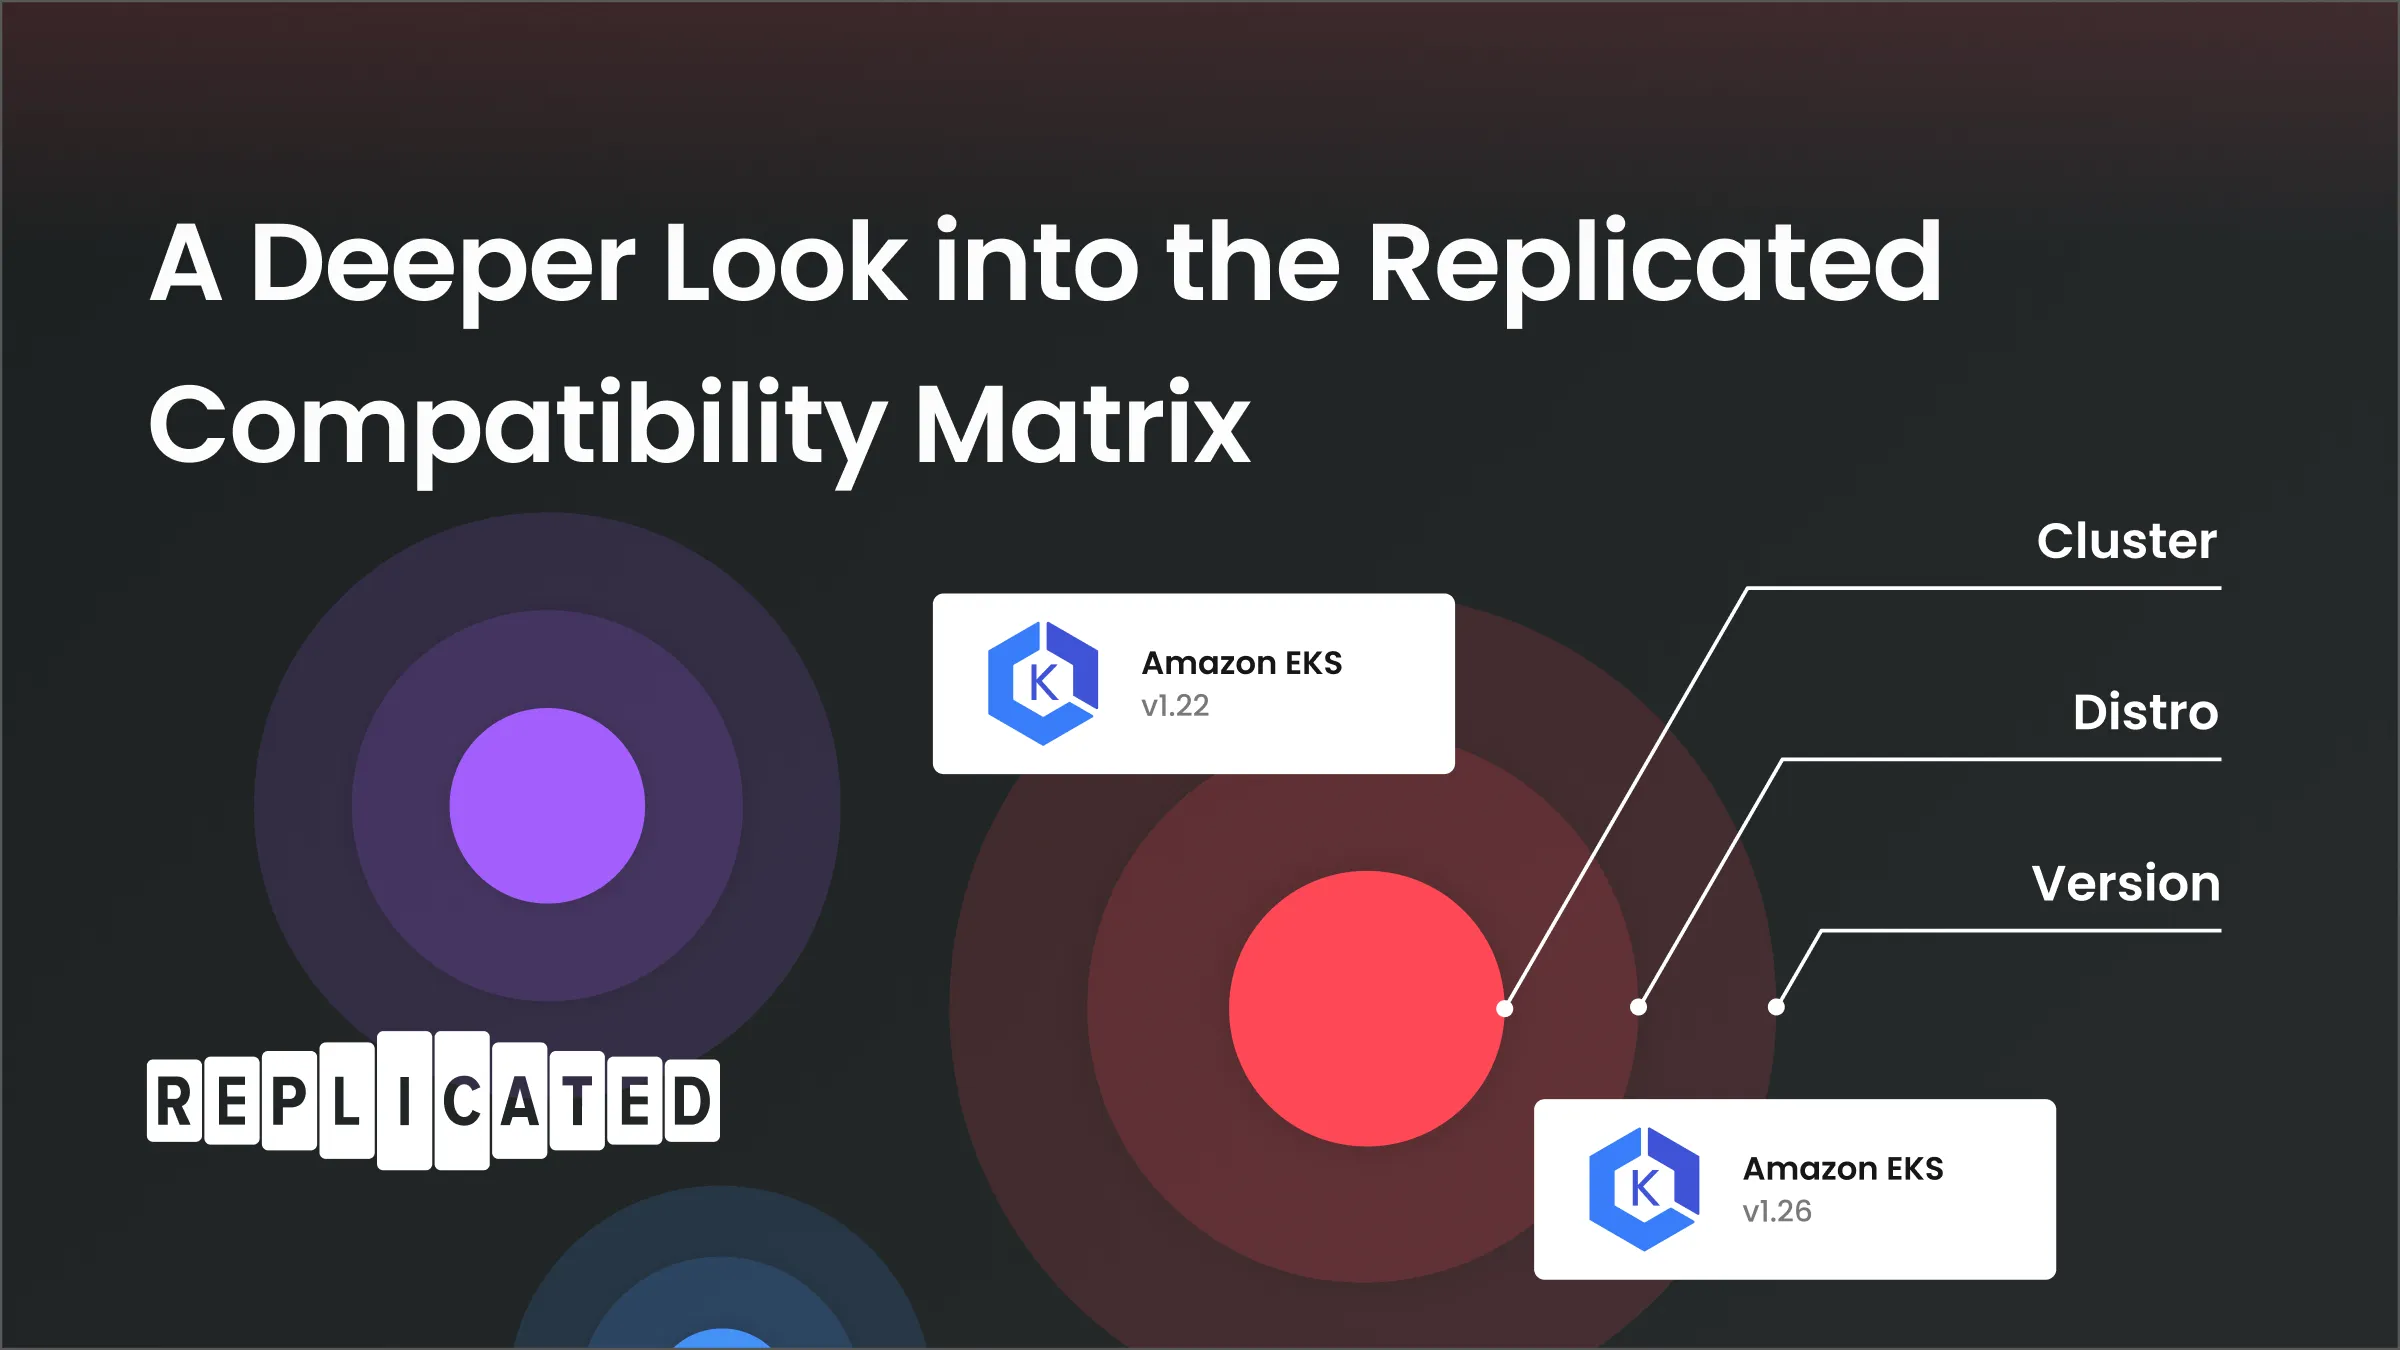
Step-by-Step Guide: Troubleshooting a Failed Deployment Using the Compatibility Matrix
Our own internal support team utilizes the Compatibility Matrix to re-create unique customer environments. Evans Mungai, Sr. Customer Reliability Engineer, walks through this process.